看懂K線圖:我用兩週時間學會的基礎技術分析
Reading Candlestick Charts: Basic Technical Analysis I Learned in Two Weeks
ローソク足チャートの読み方:2週間で学んだ基礎テクニカル分析
K線、支撐阻力不再神秘,新手兩週入門技術分析的真實心得。
Candlesticks and support levels demystified — a beginner’s honest two-week journey into technical analysis.
ローソク足とサポートラインを初心者が2週間で習得した実体験レポート。
這是《加密貨幣投資者的一年:從入門到實戰的365天旅程》系列第 8 篇,共 50 篇。上一篇我分享了用100美元買入比特幣的真實感受,這次我想聊聊緊接著發生的事——我開始看不懂圖表,然後決定花兩週時間搞清楚它。
This is article 8 of 50 in the series A Year as a Crypto Investor: A 365-Day Journey from Beginner to Practice. Last time I shared what it felt like to buy Bitcoin for the first time. Right after that, I realized I had no idea how to read the charts — so I gave myself two weeks to figure it out.
これは「仮想通貨投資家の一年:入門から実践までの365日の旅」シリーズ第8回(全50回)です。前回は初めてビットコインを購入した感覚をお伝えしました。その直後、チャートが全く読めないことに気づき、2週間で理解しようと決めました。
K線到底在說什麼?What Is a Candlestick Actually Telling You?ローソク足は何を語っているのか?
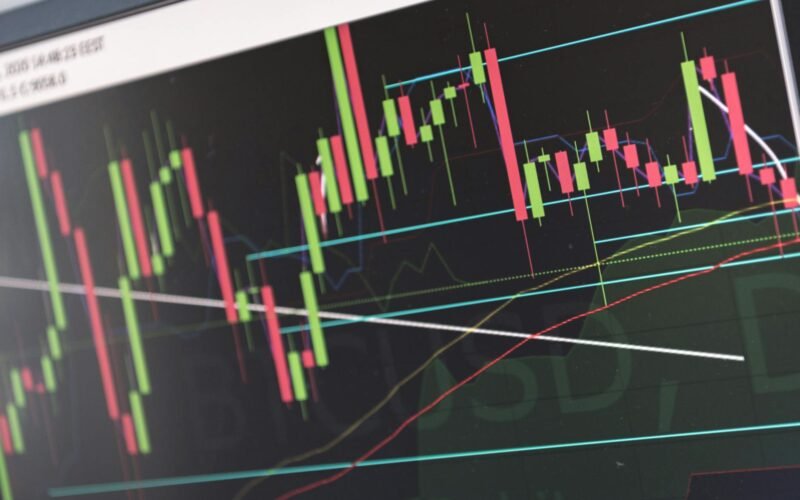
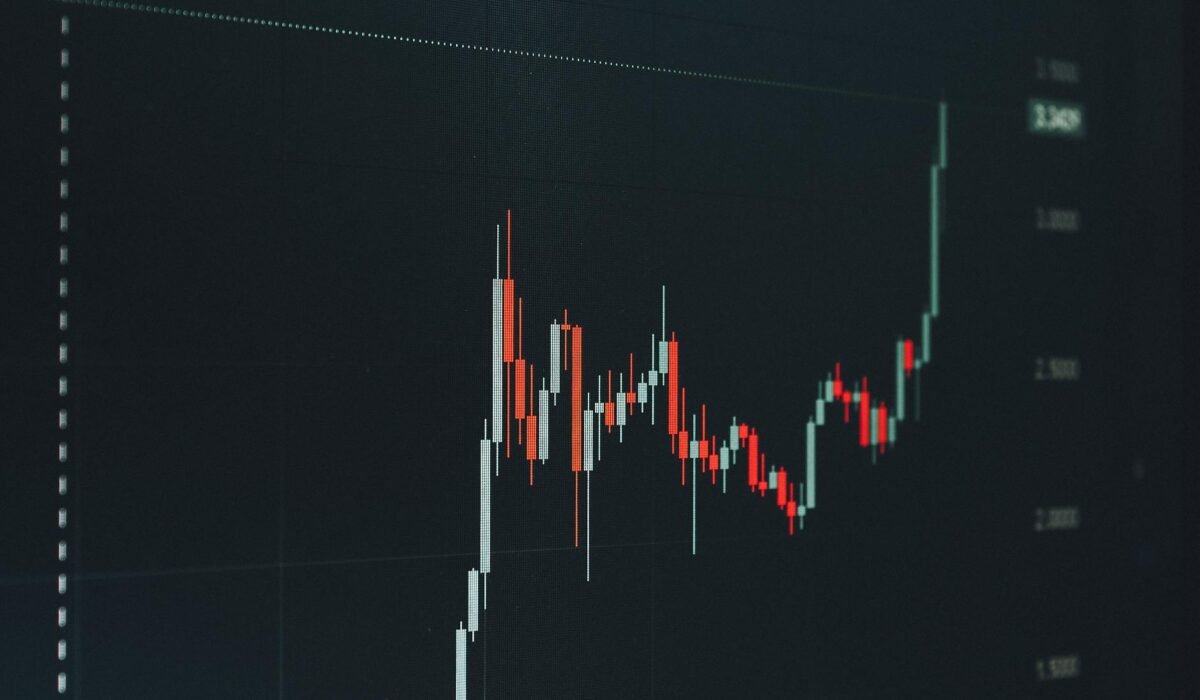
K線(蠟燭圖)是技術分析的基本單位。每一根K線代表一段時間內的四個價格:開盤價、收盤價、最高價、最低價。紅色(或黑色)代表收盤低於開盤,也就是下跌;綠色(或白色)代表收盤高於開盤,也就是上漲。燭身越長,代表當時的買賣力道越強。上下兩條細線叫做「影線」,顯示那段時間內價格曾經到達的極端位置。我第一次看到這個解釋時,突然覺得圖表不再是一堆亂碼,而是有邏輯的語言。
A candlestick represents four prices within a given time period: open, close, high, and low. A red or black candle means the price closed lower than it opened — a down move. Green or white means it closed higher — an up move. The longer the body, the stronger the buying or selling pressure. The thin lines above and below, called wicks or shadows, show the extreme prices reached during that period. Once I understood this, the chart stopped looking like noise and started feeling like a language.
ローソク足は一定期間の4つの価格を表します:始値、終値、高値、安値。赤(または黒)のローソク足は終値が始値より低い、つまり下落を意味します。緑(または白)は上昇を意味します。実体が長いほど、売買の勢いが強いことを示します。上下に伸びる細い線は「ヒゲ」と呼ばれ、その期間中に価格が到達した極端な値を示します。これを理解した瞬間、チャートがランダムなノイズではなく、論理的な言語に見えてきました。
支撐與阻力:市場的記憶Support and Resistance: The Market’s Memoryサポートとレジスタンス:市場の記憶
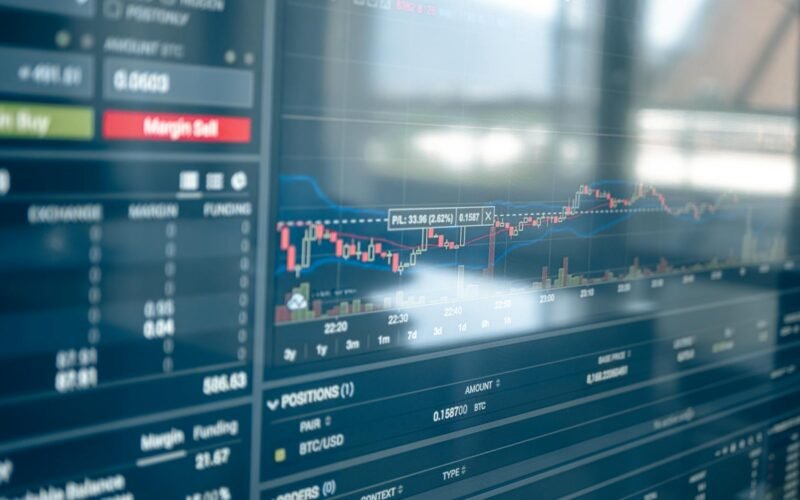
學完K線之後,我遇到了另一個核心概念:支撐與阻力。支撐是指價格反覆下跌到某個位置後就反彈的區域,代表那裡有足夠的買方力量。阻力則相反,是價格反覆上漲到某個位置後就回落的區域,代表賣方在那裡集中。這兩個概念背後的邏輯其實很人性化——市場是由人組成的,人有記憶,當某個價格曾經讓很多人虧損或獲利,他們會在那個位置再次做出反應。我開始在圖表上畫水平線,試著找出這些「有記憶的價格」,這讓我看圖的方式完全不同了。
After candlesticks, I ran into support and resistance — two of the most fundamental concepts in technical analysis. Support is a price level where the market has repeatedly bounced upward, meaning buyers tend to step in there. Resistance is the opposite: a level where price keeps getting rejected, meaning sellers dominate. The logic is surprisingly human. Markets are made of people, and people remember. If a price level caused a lot of pain or profit before, traders will react to it again. I started drawing horizontal lines on charts to find these ‘price memories,’ and it completely changed how I read a chart.
ローソク足の次に出会ったのが、サポートとレジスタンスという概念です。サポートとは、価格が繰り返し下落した後に反発するレベルで、そこに買い手が集まっていることを意味します。レジスタンスはその逆で、価格が上昇しても跳ね返されるレベルです。この概念の背後にある論理は非常に人間的です。市場は人間で構成されており、人間には記憶があります。ある价格レベルで多くの人が損失や利益を経験した場合、そのレベルで再び反応します。チャートに水平線を引いてこれらの「記憶のある価格」を探し始めると、チャートの見方が根本から変わりました。
兩週學習的最大收穫The Biggest Takeaway from Two Weeks of Learning2週間の学習で得た最大の収穫
技術分析不是預測未來,而是理解當下的市場情緒。K線告訴你買賣雙方誰佔優勢,支撐阻力告訴你市場在哪些位置有集體記憶。這些工具不能保證你每次都賺錢,但它們能讓你做決策時有依據,而不是純粹靠感覺。兩週之後,我不敢說自己是技術分析高手,但我至少能看懂圖表在說什麼了。這種「從看不懂到看得懂」的轉變,讓我對加密貨幣市場多了一份踏實感。下一篇,我們會聊到更大的視角——牛市與熊市,以及市場週期如何影響你的每一個決策。
下一篇(第9篇):什麼是牛市?什麼是熊市?市場週期如何影響你的決策
Technical analysis isn’t about predicting the future — it’s about understanding current market sentiment. Candlesticks show you who’s winning between buyers and sellers. Support and resistance show you where the market has collective memory. These tools won’t guarantee profits, but they give your decisions a foundation beyond gut feeling. After two weeks, I wouldn’t call myself an expert, but I could finally read what a chart was saying. That shift — from confusion to comprehension — gave me a much more grounded feeling about navigating crypto markets. Next up, we zoom out to the bigger picture: bull markets, bear markets, and how market cycles shape every decision you make.
Previous: My First Buy Order: What It Felt Like to Buy Bitcoin with $100
Next (Part 9): What Is a Bull Market? What Is a Bear Market? How Market Cycles Affect Your Decisions
テクニカル分析は未来を予測するものではなく、現在の市場心理を理解するためのものです。ローソク足は買い手と売り手のどちらが優勢かを示し、サポートとレジスタンスは市場が集合的な記憶を持つ価格帯を示します。これらのツールは利益を保証するものではありませんが、感覚だけでなく根拠のある意思決定を可能にします。2週間後、自分をエキスパートとは言えませんが、チャートが何を語っているかは理解できるようになりました。「わからない」から「わかる」へのこの変化が、仮想通貨市場に対してより確かな感覚をもたらしてくれました。次回は、より大きな視点——強気相場と弱気相場、そして市場サイクルがあなたの意思決定にどう影響するかについてお話しします。
前回:初めての買い注文:100ドルでビットコインを買った感覚
次回(第9回):強気相場とは?弱気相場とは?市場サイクルがあなたの判断に与える影響